PTE Speaking: Mastering the Describe Image Task: As a competent SEO and senior copywriter, I understand the importance of creating high-quality content that not only engages readers but also ranks well in search engines. In this comprehensive article, we will delve into the PTE Speaking “Describe Image” task, providing you with examples and valuable practice tips to help you excel in this section of the exam.
What is the PTE Speaking Describe Image Task?
The “Describe Image” task is a crucial component of the Pearson Test of English (PTE) Speaking section. In this task, candidates are presented with an image, such as a graph, chart, table, or diagram, and they are required to describe it in detail within a given time frame. This task assesses the candidate’s ability to analyze visual information, organize their thoughts coherently, and convey the key points effectively.
Tips for Approaching the Describe Image Task
1. Analyze the Image Carefully
Before you start describing the image, take a moment to analyze it thoroughly. Identify the main trends, patterns, or significant data points that stand out. Pay attention to the title and labels as they provide valuable context for understanding the image.
2. Use Structured Approach
Organize your response in a structured manner. Begin with an introduction that paraphrases the information provided in the image and outlines the main trends. Then, move on to the body paragraphs, each focusing on specific aspects or data points of the image. Conclude your response by summarizing the key findings.
3. Practice Time Management
The “Describe Image” task is time-bound, and managing your time effectively is crucial. Allocate a few seconds to understand the image and plan your response. Aim to complete your description within the allocated time while ensuring clarity and coherence.
Sample “Describe Image” Responses
Example 1: Line Graph
Image Description:
Response: The line graph illustrates the population growth of City X over a ten-year period from 2010 to 2020. The x-axis represents the years, while the y-axis shows the population figures in thousands.
As observed, the population of City X witnessed a steady rise throughout the decade, with slight fluctuations. In 2010, the population was approximately 80,000, and it gradually increased to nearly 110,000 by 2020.
The most significant growth occurred between 2015 and 2017, where the population surged from around 90,000 to 105,000. Afterward, the growth rate stabilized, showing a marginal increase.
Overall, the line graph highlights the progressive growth in City X’s population over the ten-year period, indicating a positive trend.
Example 2: Pie Chart
Image Description:

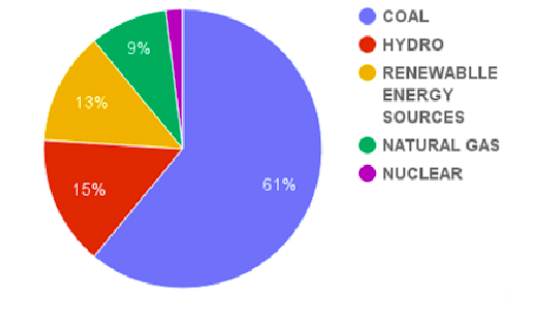
Response: The pie chart provides a breakdown of the energy sources used for electricity generation in Country Y in the year 2020. The chart displays five different energy sources, each represented as a percentage of the total energy generation.
As depicted, the most significant contributor to electricity generation is Coal, accounting for 61% of the total. This is followed by Hydro, contributing 15%. Renewable energy sources, including wind and solar, make up 13% of the energy mix, showcasing a growing emphasis on sustainable practices.
Naturalgas contributes 9% to energy generation, while nuclear power has the smallest share at 5%.
The pie chart indicates that Country Y heavily relies on non-renewable energy sources, but there is a positive shift towards incorporating more renewable energy options.
Effective Practice Strategies for PTE Speaking
1. Regularly Practice with Different Images
To improve your performance in the “Describe Image” task, practice regularly with various types of images. Access sample questions or find image resources online to challenge yourself with diverse visual representations.
2. Simulate Test Conditions
Recreate the exam environment during your practice sessions. Set a timer, and adhere to the time limits for each task. This will help you manage your time efficiently during the actual test.
3. Seek Feedback
Record your practice sessions and listen to your responses. Identify areas for improvement and seek feedback from mentors, teachers, or language experts. Constructive feedback can significantly enhance your speaking skills.
4. Expand Vocabulary and Fluency
Aim to enhance your vocabulary and fluency in English. Read extensively, listen to English podcasts or watch English movies to expose yourself to different accents and speaking styles.
Mastering the PTE Speaking “Describe Image” task is achievable with consistent practice and a structured approach. Analyze images carefully, organize your responses coherently, and manage your time effectively. With regular practice and dedication, you can confidently tackle this task and excel in the PTE Speaking section.
Remember, continuous improvement is key, and embracing opportunities for growth will undoubtedly set you on the path to success. Best of luck on your PTE journey!
Summary:
- Master the PTE Speaking “Describe Image” task with valuable tips and practice examples.
- Analyze images, use a structured approach, and manage time effectively for success.
- Sample responses for line graphs and pie charts provided for guidance.
- Regular practice, feedback, and improved language skills lead to proficiency.
- Excel in the PTE exam by following the comprehensive strategies in the article.


